Russell Reynolds Associates & Infographics
It’s hard to imagine a world without infographics. Increasingly, people and businesses realize that images can say so much more than words. That’s where we come in. We utilize the growing pool of existing tools to help clients make their own impressive graphs. There are some really effective solutions out there. An example is Infogram - a tool for easy infographic creation. We sat down with Polly Borrows from global search and leadership advisory Russell Reynolds Associates and our Creative Director, Paul van Hattem to discuss their experiences with it so far.
Infogram tells on-brand story
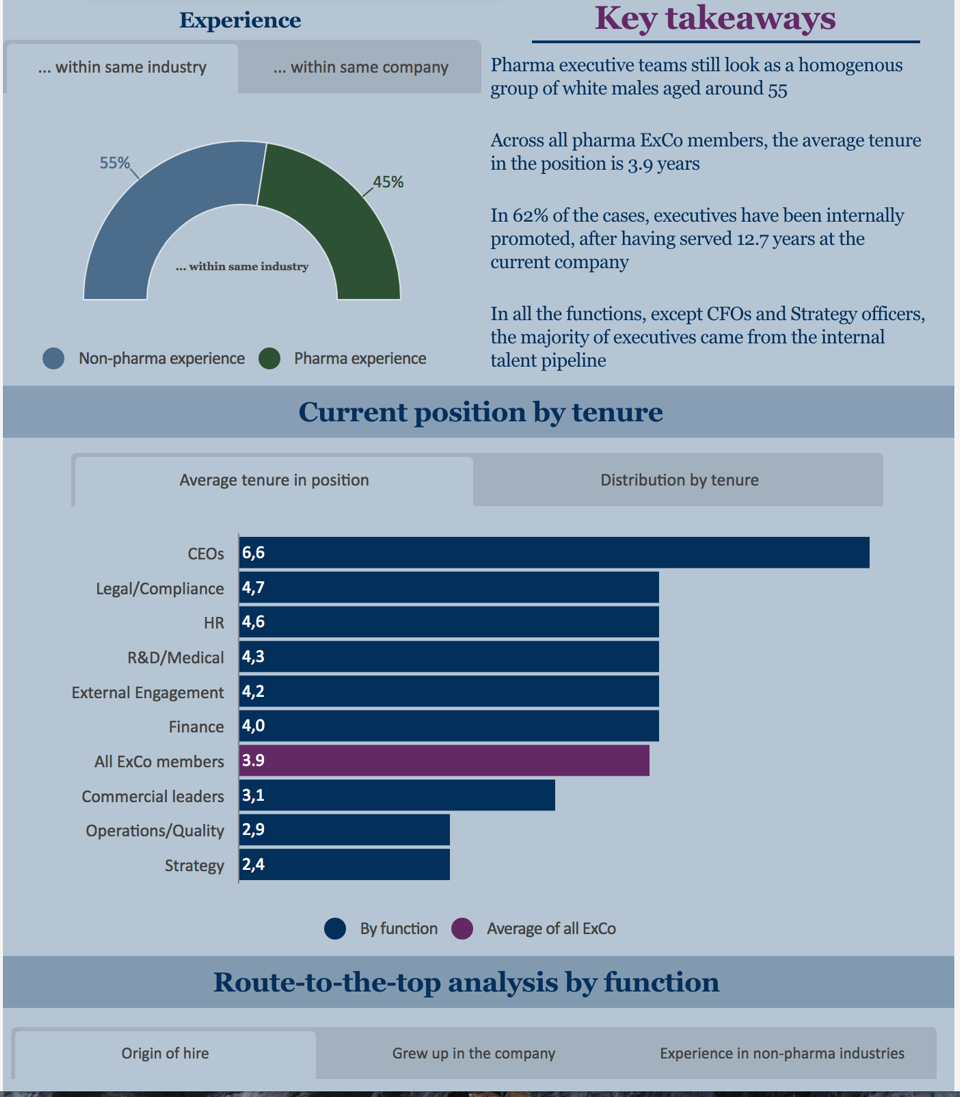
As a Knowledge Consultant with Russell Reynolds, Polly works on concept creation. She uses data to show market trends and issues, she enjoys working with graphs and infographics to support her findings. An example is ‘Route to the Top.’ For this project, she visualizes the career paths of CEOs at pharma companies and their direct reports, showing their background and how they got to where they are today. A custom template was used to support the visuals.
Russell Reynolds has an in-house graphic designer, so there’s no need for Polly to spend much time looking for new graphic design tools. However, for Route to the Top she has been working with Infogram. “What I like most about Infogram is that Mr.Prezident have taken our company colours that we use for all external communication and have created a template within Infogram using them. We can then select the template whenever we use Infogram, giving infographics the same company look and feel as other RRA materials we produce.”
Being no designer, when starting to use it, Polly had to “fiddle with the tool a bit” but finds it intuitive and easy to figure out. “One of the other good things about the tool is the interactive functionality for the charts and maps.” being able to show various forecast and before and after projects in an animated graph is highly valuable. The one downside is the current social sharing capabilities. ,“That works best when you link to the Infogram site, but we would prefer to link the visuals to our own website”.
Support on graphic tools
Always on top of the latest design trends, Mr.Prezident’s Paul knows how important tools like Infogram are. We provide custom made graphics and therefore do not use such tools. However, we also empower our clients with the tools they need for their presentations. This can include giving a training on how to use certain tools. In the case of Russell Reynolds Associates, Paul provided a training on how to use Infogram. What does he like most about it? The fact that you can modify your graphs into any format you like. And that interactive maps can be used.
Need agency to tell a real story
The down-side? If you really want to tell a visual story, it can make a big difference to hire a design agency to make sure your visuals are powerful and convey the underlying message. An agency assists you with your storyline and finds creative ways to transform your data into visuals. That’s also the main disadvantage that Paul sees when it comes to tools like these. “Nevertheless, infographics are a real nice mid-level solution for storytelling, contributing to the visual world we live in” he says. In short, the rise of ‘do-it-yourself’ tools for graphic design made us look into one of these tools, Infogram. A great one for helping companies to tell stories!